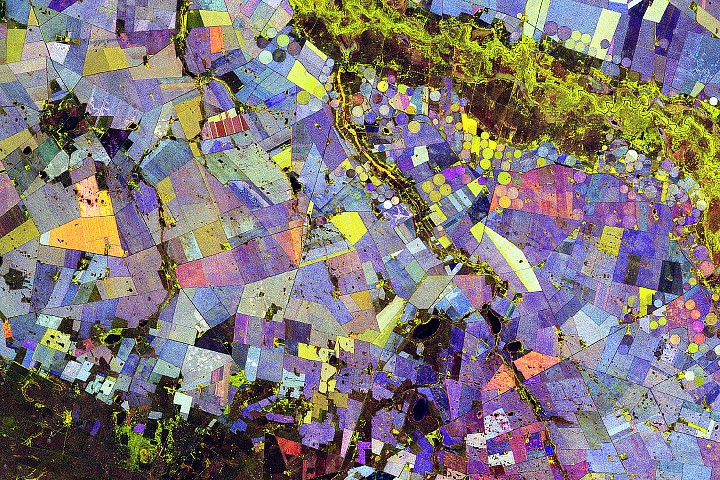
Along the Vetrivier in South Africa’s Free State province, a patchwork of circular and rectangular fields has transformed a semi-arid landscape into something that looks suspiciously like a modern art installation. The area, roughly 110 kilometers (70 miles) north of Bloemfontein, sits in the heart of the Maize Triangle, where irrigation brings life to an array of crops.
But don’t hang this on your wall just yet - each splash of red, green, and blue in the false-color composite actually means something. The data comes from the NISAR satellite (that’s NASA-ISRO Synthetic Aperture Radar to you), which made 10 passes over the region between November 2025 and March 2026. Instead of using visible light, NISAR’s L-band radar sees vegetation by its structure, not its color. Scientists then crunched the radar signals into per-pixel statistics, creating a compact summary of seasonal agricultural activity.
“It’s a pretty picture, but there are also important things that it communicates to us,” said Paul Siqueira, a scientist at the University of Massachusetts Amherst and ecosystems lead for NISAR. “With NISAR, crops like maize and sunflower appear differently than forests because of their size differences and period of growth.”
Here’s the color code for this landscape painting: green means vegetation, red means bare ground, and blue indicates how quickly vegetation changed over the season. Stable forests show up as light blue. Plants that change structure dramatically - like wheat and maize - appear darker blue. Most pixels are a mix, so a field of sunflowers that grows fast and gets harvested early might look orange.
The processing is straightforward but data-intensive. NISAR beams radar signals to Earth and measures how they bounce back, with the orientation of the returned waves (cross-polarized or co-polarized) revealing vegetation structure. By combining multiple passes and calculating stats for each pixel, the team built a detailed map of the growing season.
The technique offers a repeatable way to monitor crop development, irrigation impacts, and land-use change across huge areas. As NISAR collects more data, researchers will compare seasons, track field-to-field growth differences, and figure out how agriculture responds to water availability and climate variability. In other words, it’s art that actually does something.
The Good Times
News in your inbox.
One sardonic roundup, delivered on your schedule. Free. Unsubscribe whenever your tolerance for wit runs out.
Already subscribed but we never reach your inbox? Check your spam folder and hit 'Not spam' (or 'Remove from spam') to bust us out of junk-mail purgatory. You'll be helping everyone else too.
Don't open any of our emails for a month and you'll be automatically removed from the mailing list.
Rewrite Article
Select parts to regenerate with a fresh AI pass. Translations will be updated automatically.
Generate AI Image
Creates a sardonic version of the article image using OpenAI.